

Product release
Client Dashboard — See What They're Researching, and When
A dealership workspace for research visibility your website cannot give you: which named shopper is studying which car, how seriously they engaged, and when they were actually looking, so your team follows up while the research is still happening.

Release Overview
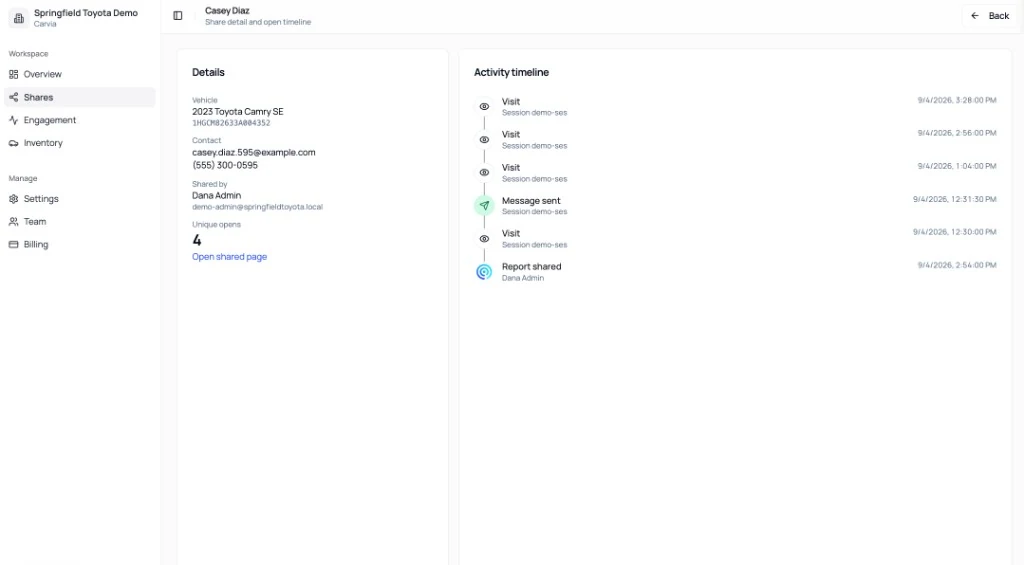
Your dealership website can show that someone hit a vehicle page. It cannot tell a salesperson that Casey Diaz is researching this 2023 Camry SE right now, for the fourth time today.
The Client Dashboard closes that gap. After your team sends a Get My Full Report share, Carvia gives you named-shopper visibility on that exact car: unique opens, engaged sessions, dealer contact, and a visit-by-visit activity timeline so you follow up while the research is still happening.
This is not another anonymous traffic chart. It is a sales workspace built for one question every floor manager already asks: What are they researching, and when should we call?
The Problem We Solved
Your website cannot tell you when an exact shopper is looking at, considering, or researching their car.
Dealer sites and GA4 are built for anonymous traffic: VDP views, bounce rate, campaign source. That is useful for marketing. It does not help a salesperson decide who to call next.
Most CRMs are built for a static lead record: created, assigned, last contacted. Useful for follow-up discipline. They do not show that the same buyer opened the Camry four times between lunch and 3:28 PM.
And when a rep texts a raw dealer-site link, the conversation goes dark after send. You hope they looked. You guess when to follow up. Hot be-backs and cold texts look the same in the queue.
The share-detail view below is what that gap looks like closed: a named buyer, a named vehicle, four unique opens, and a timeline your website will never surface.
What's New
A dealership workspace under Overview, Shares, Engagement, and Inventory — built for sales visibility after every share.
Overview: rooftop share health
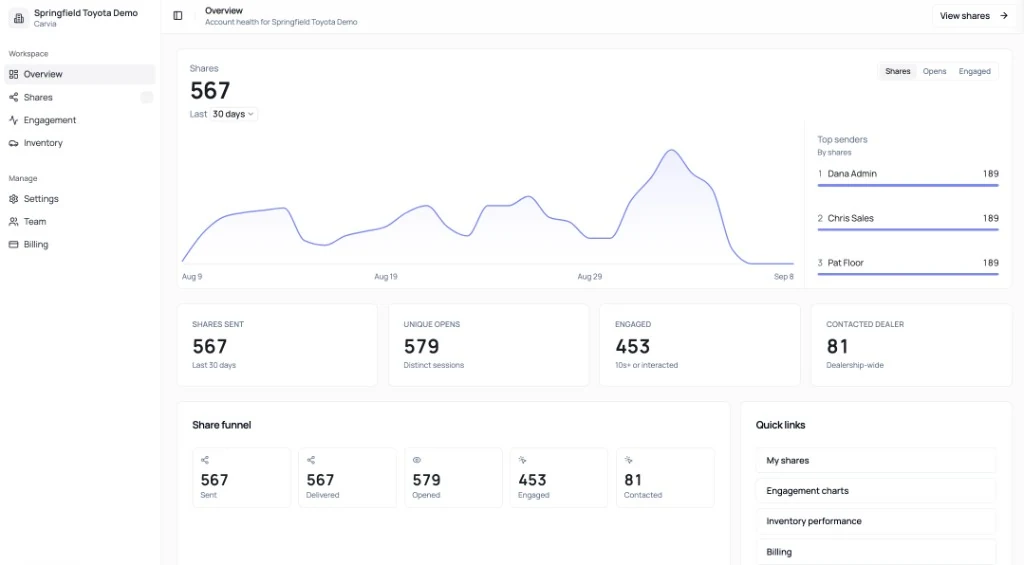
A 30-day trend for shares, opens, and engaged sessions, plus KPI cards and a share funnel: Sent → Delivered → Opened → Engaged → Contacted. Admins see account health for the store. Salespeople see their own share performance. Top senders show who is driving outbound volume.
Shares list and share detail
Search and filter every send: vehicle, buyer, sender, unique opens, and last opened. Open a row for contact details, a link back to the shared page, and a chronological activity timeline (visits, engaged moments, email opens, chat, dealer-site clicks, and Message dealer events).
Engagement charts and active customers
Volume and funnel charts, a most-active customer list scored with recency, a rep leaderboard, and an open-timing heatmap (hour × day of week) so managers see when this rooftop's buyers actually look.
Inventory performance by VIN
Last-30-day shares and unique opens per vehicle. Feature the units shoppers are studying, and prioritize follow-up around the cars that already have named interest.
Metrics that match the product
Unique opens = distinct sessions. Engaged = 10s+ on the shared page or an interaction. Contacted dealer = Message dealer from the shared page (dealership-wide). These are the labels your team will see in the UI.
Insights You Can Use on the Floor
Visibility only matters if it changes the next phone call. Here is how sales teams use the dashboard day to day.
Call while they are looking
Four visits in one afternoon is a hot be-back, not a cold “just checking in.” Open the timeline, see the last visit, and call while the Camry is still on their mind. Your website will never hand you that moment.
Work unique opens, not last-texted
Sort Shares by opens or last opened. The buyer who came back twice yesterday jumps the queue ahead of the contact who never opened. Unique opens turn a flat lead list into a research-aware worklist.
Activity vs. quality on the team
Top senders show who is sharing. Engaged vs. sent shows whether those shares earn attention. Managers can celebrate volume and coach for quality without waiting for Monday anecdotes.
Outreach when this rooftop's buyers look
The open-timing heatmap answers a practical question: when do our shared pages actually get opened? Align BDC dials and text follow-ups with the hours your shoppers research — not a generic industry script.
Feature the cars people are studying
VINs with high unique opens are the units to put in today's social posts, lot walks, and manager huddles. Pair inventory heat with named share timelines and you know both which cars and which buyers deserve attention.
Value by Role
For general managers and sales managers
- Pipeline you can coach against — rooftop funnel and top senders show whether outbound share motion is real this month
- Quality, not just volume — engaged and contacted dealer metrics separate busy sending from serious shopper interest
- Huddle-ready examples — pull a share detail timeline into the morning meeting instead of debating who is working leads
Scenario: Your sample Overview shows hundreds of shares in 30 days with a clear engaged and contacted-dealer drop-off. You coach the floor on follow-up timing, not on “send more links.”
For sales professionals and BDC
- Named buyer, named car — know exactly who opened which report before you dial
- Conversation starters with proof — “I see you spent time on the Camry report again this afternoon”
- My shares first — filter to your sends, then drill into the hottest unique-open counts
Scenario: Casey Diaz opens the Camry report four times and sends a message from the shared page. You call with the timeline open, address the question they already asked, and skip the generic be-back script.
For internet and marketing directors
- Outcome layer on top of traffic — GA4 still owns anonymous site analytics; the client dashboard owns named share outcomes
- Inventory storytelling — feature VINs with rising unique opens in paid and social creative
- Complementary to impact emails — Widget Analytics proves VDP widget value in the inbox; this dashboard proves share follow-up value for the sales team
Getting Started
If Shared Vehicle Pages are already enabled, your team can use the dashboard today.
- Sign in at carvia.ai/client with your dealership Carvia account.
- Send a report from any live VDP using Get My Full Report (check I am the dealer so the send is attributed to you).
- Open Overview for 30-day share health, the funnel, and top senders.
- Go to Shares, find the buyer, and open their detail page for unique opens and the activity timeline.
- Use Engagement and Inventory for active-customer rankings, open timing, and per-VIN heat when you coach the floor or plan merchandising.
Your website will keep counting anonymous pageviews. The Client Dashboard tells your sales team what a named shopper is researching — and when to pick up the phone.